Risk Appetite
This page presents two examples illustrating how Bayesian networks can be used to model and analyse organisational risk appetite. The two examples are taken from the literature; the journal paper [Andersen et al, 2010] and the presentation [Leisner et al, 2010].
A Bayesian network is a compact representation of a joint probability distribution over a set of variables. It consists of two parts (1) a directed acyclic graph (DAG) specifying dependence and independence relations between the variables in the model and (2) a set of conditional probability distributions quantifying the dependence relations defined by the DAG. Bayesian networks can be constructed from data or expert knowledge, or a combination of data and expert knowledge. This makes them an excellent tool for knowledge integration and representation. The graphical structure of a Bayesian network makes it an efficient tool for communicating and discussing cause and effect relations as well as relations between factors.
For more information on Bayesian networks, see e.g., [Kjærulff and Madsen, 2013].
Organisational Risk Appetite - Using AIG as an example
This example is taken from [Andersen et al, 2010].
Introduction
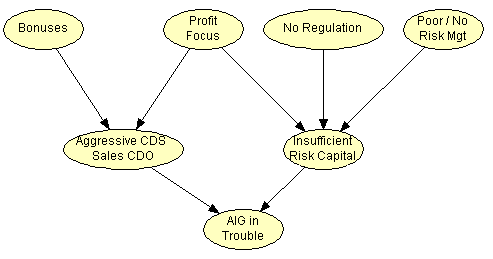
The figure below shows the structure of a Bayesian network model taken from [Andersen et al, 2010]. The model represents operational risk exposure of insurance companies as part of a larger Bayesian network including pivotal events and central actors involved in the recent financial crisis [Andersen et al, 2010].
The authors use Bayesian networks to structure causes and influencing factors in order to analyse the financial crisis in an operational risk managment context focusing on to what extend the emergence of the crisis can be tracted back to operational risk management exposure within banks, mortgage brokers, investment banks, credit rating agencies and insurance companies. Here we focus on the part of the model related to insurance companies. In particular, we focus on AIG Financial Products and how lack of operation risk management got AIG into trouble.
The simplified network shown below consists of seven random variables. One variable representing the event that AIG gets in trouble due to aggressive sales of Credit Default Swaps (CDS) insurance on Collateralized Debt Obligations (CDO), i.e., Aggressive CDS sales CDO, and Insufficient Risk Capital, and four influencing factors.
The network has root cause variables representing Bonuses, Profit Focus, No Regulation (AIG Financial Products is not an insurance company and therefore not under the same regulation as AIG) and Poor/No Risk management.
Using the Network
Here are some HUGIN widgets for interacting with the model shown on the above (click on the probability bar to instantiate a node or remove evidence):
Bonuses
Profit focus
No regulation
Risk management
Agressive CDS sales CDO
Insufficient risk capital
AIG in trouble
The traffic light shown above translates the probability of AIG being in trouble to a color code, i.e., green, yellow and red, using a set of predefined thresholds.
The Bayesian network (and its interface) can be used to analyse how the risk of AIG being in trouble is impacted by bonuses, profit focus, regulation and risk management. This makes it possible to determine and analyse the impact of, for instance, changing profit focus. This can be used as an instrument in analysing risk appetite and identifying initiatives that may either increase or descrease organisational risk appetite.
Lehman Brothers Bankruptcy
This example is taken from [Leisner, 2012].
Introduction
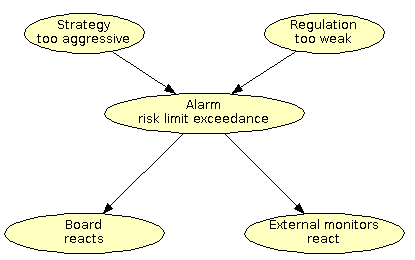
The figure below shows the structure of a Bayesian network model taken from [Leisner, 2012].
Using the Network
Here are some HUGIN widgets for interacting with the model shown on the above (click on the probability bar to instantiate a node or remove evidence):
Strategy too agressive
Regulation too weak
Alarm risk limit exceedance
Board reacts
External monitors react
The Bayesian network can be used to answer both deductive and diagnostic questions such as what is the probability that Lehman's board reacts given the strategy was in fact too aggressive? and what is the probability that Lehman's strategy was too aggressive given the board in fact did react?
References
[Andersen et al, 2012] Andersen, L.B., Hager, D., Maberg, S. Næss, M.B. and Tungland, M. (2012) The financial crisis in an operational risk management context a A review of causes and influencing factors in Reliability Engineering and Systems Safety 105, pp 3-12.
[Leisner, 2012] Leisner, Martin Falk (2012)
Modeling OpRisk With Bayesian networks, conceptualization: forestry
- case: Lehman. Meeting - The Risk Manangement network, DDF/CFA
Denmark/PRMIA, March 12, 2012 Copenhagen.
[Kjærulff and Madsen, 2013]
Kjærulff, U.B. and Madsen, A.L. (2013) Bayesian Networks and
Influence Diagrams: A Guide to Construction and Analysis. Second
Edition. Springer.
Contact information
For further details contact: Anders L Madsen at anders-at-hugin-dot-com