Diagnosing Significant Adverse Effect of the EU Water Framework Directive on Hydropower Production in Norway
By: David N. Barton (NINA), Tor Haakon Bakken (SINTEF) and Anders L Madsen (HUGIN)
5 November 2015
The paper is online here
Introduction
Before 2022, several hundred hydropower concessions may come up for revision of terms in Norway, potentially enabling change in environmental flow requirements. Norway is currently developing regional management plans under the EU Water Framework Directive (WFD) for the planning period 2021-2033. Plans will include environmental objectives and measures for heavily modified water bodies, which should guide subsequent sectoral decisions. Norwegian authorities have recently undertaken a screening of 395 of the hydropower concessions in 187 catchments /sub-catchments up for revision before 2022 in order to prioritize which concession to revise according to the their environmental and hydropower importance (Sørensen et al., 2013; Halleraker et al., 2014) (henceforth 'Concession Screening Project'). Prioritized concessions have in common the restrictions on hydropower production in terms of regulated streamflow or certain reservoir conditions. The Concession Screening Project combined a GIS platform for mapping environmental impacts1 and a multi-criteria ranking methodology which includes impact scoring, valuation and weighting of criteria for hydropower impact on fish, biodiversity and recreation, hydropower production. Sørensen et al. 2013 conclude from their ranking that implementing minimum flow (Q95) in prioritised catchments would mean a total power loss - relative to no concession restrictions - of a total 2,3-3,6 TWh/yr. or 1,8-2,8% percent of median national annual power production. The national level screening and ranking of projects serves only as guidance for regional plans of River Basin Authorities. Actual environmental considerations and production constraints in revised concessions, and the potential for environmental improvements using measures without impact on hydropower production (e.g. habitat improvements), will be determined on an individual basis.
Hydropower Concession Screening Methodology and Data
The descriptions of the concessions under revision was obtained from the Norwegian Environment Agency, and include observations on all the evaluation criteria across a total N=187 concession revision objects - catchments or sub-catchments grouping 395 individual concessions. The data are described in detail in Sørensen et al. (2013) and as a case study in WFD CIS (2015). The screening project methodology used three assessment matrices to rank concession objects according to Table 1.
| 1.1 | High Priority | Catchments with a large potential for improvement of important environmental values and low or moderate estimated power loss in relation to environmental benefits |
| 1.2 | Lower Priority | Catchments with intermediate potential for improvement of important envi-ronmental values and greater estimated power losses (compared to 1.1) rela-tive to environmental benefits |
| 2.1 | Not prioritised | Catchments with smaller environmental values and impacts of hydropower |
| 2.2 | Not prioritised, special considerations | Catchments with important environmental values, but with limited remaining environmental challenges, or where special considerations place limits on the mitigation measures that can be carried out |
Concession revision objects' importance were assessed in terms of impact and value based on available mapping data, modeling and expert judgement.
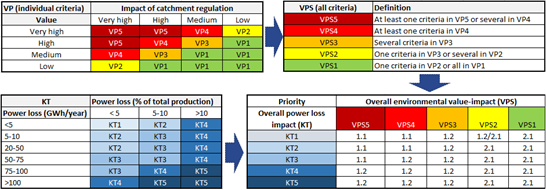
The Concession Screening Project used look-up tables for assessing concession revision priority based on environmental and power loss importance (Table 2). Environmental criteria (i-iii) were assessed accord-ing to value and impact of catchment regulation on a 5 point scale of importance, labelled "VP category" (upper r.h. panel). Environmental importance for individual criteria were then aggregated using look-up Table 2 into an Overall Environmental value-impact, labelled "VPS category" (upper l.h.panel). Absolute foregone power (GWh/year) and foregone power as a % of total production for the catchment/sub-catchment were combined to determine the importance of Overall power loss on a 5 point scale, labelled KT category (lower r.h. panel). Concession revision priority is determined by combining Overall Environmental value-impact (VPS) and Overall power loss impact (KT) (lower l.h. panel).
Concession Screening Methodology Formalized as MCDA
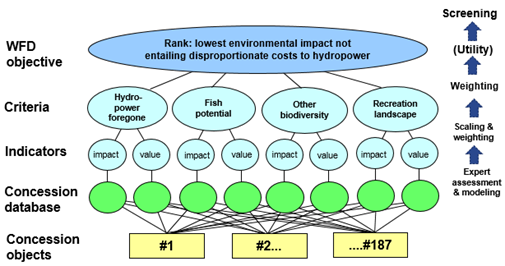
In the Concession Screening Project the look-up tables combine impact and value in a single look-up table which corresponds to the separate steps of scaling and weighting in an MCDA (Figure 1). The combination of hydropower loss and environmental importance constitute a second level of scaling and weighting. While the Screening Project Report explains all look-up tables and the methodology in detail, it is still difficult to compute the relative weighting of environmental versus economic criteria without the aid of modeling tools. The trade-off between hydropower costs and environmental criteria is not as trans-parent as it could be. Assessment of the combined effect of the look-up tables in terms of a formal MCDA structure helps clarify trade-offs across criteria and identify costs of significant adverse effect implicit in the criteria of the screening methodology.
Bayesian Belief Network
The network structure of the criteria hierarchy illustrated in Figure 1 is well suited for implementation as a Bayesian belief network (BBN). Figure 2 shows the Concession revision projects criteria hierarchy with variables from the look-up tables shown in Table 2(blue and green nodes) and concession object assessment variables (yellow nodes). Hugin Data Learning2 identified correlations between data quality, value and impact indicators. water region. Correlations provide some insight into possible systematic effects of expert judgement in evaluating the environmental importance of each concession. Data quality was correlated for the impact criteria - similar quality assessment methods tended to be used for any given concession object. Biodiversity and fish data quality was correlated with water region, while this was not the case for landscape-recreational data quality. Value was codetermined with impact for the environmental criteria. In other words, experts based value judgements about biodiversity, fish, landscape-recreation on information about impact. That value judgements are determined by the magnitude of impacts is an important finding because formal MCDA attempts to separate subjective value judgements from ideally objective assessment of biophysical impact. In practice we see that experts confound value and impact.
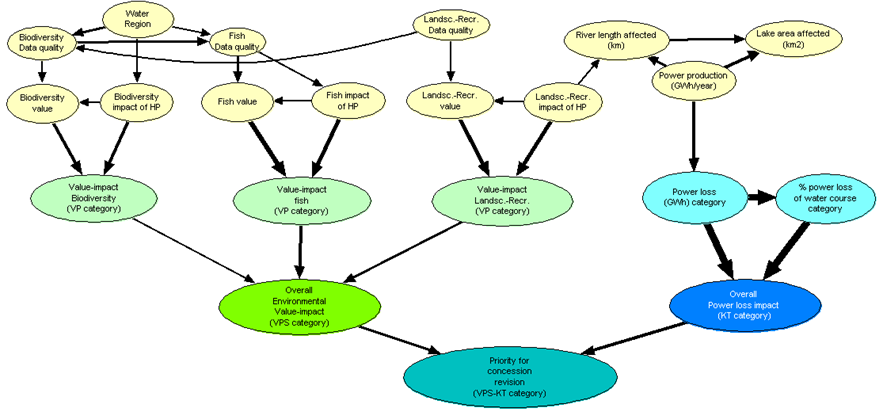
Note: the width of the links indicates the relative amount of information different parent nodes have in explaining values of child nodes. For examples, power loss variables explain overall power loss impact more strongly than biodiversity, fish and landscape recreation value-impact explain overall environmental impact.
In the following online BBN you see the dashboard of the node monitors showing probability distributions for each node, which together describe the characteristics of the N=187 concession objects. Green bars represent relative frequencies; decimal numbers represent probabilities with the discrete states labeled on the right.
Footnotes
[1]
http://www.miljodirektoratet.no/no/Tjenester-og-verktoy/Database/Vassdragsatlas/
[2]
Network joint probabilities were learned from the dataset using a
maximum likelihood procedure (Hugin 2014), constrained to fit a
network structure where P(VPS|VP), P(KT|Gwh,%loss) and P(VPS-KT | VPS,
KT). Several net-work structures for correlation structures between
assessment variables were tested,picking the model with the highes
log-likelihood and information criteria. The chosen model converged
at Log-likelihood: -3056.3 AIC: -4848.3 BIC: -7743.38
References
Barton, D.N., Bakken, T.H., 2016. Diagnosing Significant Adverse Effect of the EU Water Framework Directive on Hydropower Production in Norway Using a Multi-Criteria Bayesian Network Approach (forthcoming).
Halleraker, J.H., Sørensen, J., Bjørnhaug, M., Brodtkorb, E., Fjellanger, J., Haug, I., Langåker, R.M., Selboe, O.K., 2014. National Screening and Prioritization of Hydropower Licences for Revision of Tersm, with Emphasis on Mitigation Measures Affecting Hydopower. 10th International Symposium on Ecohydraulics http://www.cedren.no/Arrangementer/Event/ArticleId/2047/10th-International-symposium-on-ecohydraulics Trondheim, Norway.
Sørensen, J., Halleraker, J.H., Bjørnhaug, M., Langåker, R.M., Selboe, O.K., Brodtkorb, E., Haug, I., Fjellanger, J., 2013. Vannkraftkonsesjoner som kan revideres innen 2022. Nasjonal gjennomgang og forslag til prioritering.Rapport nr. 49/2013.
Useful references for those interested in BBN include:
Kjærulff, U. B. and Madsen, A. L. (2013) Bayesian Networks and Influence Diagrams: A Guide to Construction and Analysis. Springer, Second Edition.
Contact information
For further details on the paper: David N. Barton (NINA)
For further details on the use of Bayesian networks and web deployment of models contact: Anders L Madsen (alm(at)hugin(dot)com)