Example Breeding Pigs
By: Lauritzen et al, 2001
This example illustrates how a sequence of test-and-treat decisions related to breeding pigs can be modelled and what a user friendly web interface may look.
The example taken from Lauritzen & Nilsson (2001) is fictitious, but more realistic variants have served as motivation for the theoretical development in the aforementioned manuscript. The story is:
A pig breeder is growing pigs for a period of four months and subsequently selling them. During this period the pig may or may not develop a certain disease. If the pig has the disease at the time when it must be sold, the pig must be sold for slaughtering and its expected market price is then 300 DKK (Danish kroner). If it is disease free, its expected market price as a breeding animal is 1000 DKK.
Once a month, a veterinary doctor sees the pig and makes a test for presence of the disease. If the pig is ill, the test will indicate this with probability .80, and if the pig is healthy, the test will indicate this with probability .90. At each monthly visit, the doctor may or may not treat the pig for the disease by injecting a certain drug. The cost of an injection is 100 DKK.
A pig has the disease in the first month with probability .10. A healthy pig develops the disease in the subsequent month with probability .20 without injection, whereas a healthy and treated pig develops the disease with probability .10, so the injection has some preventive effect. An untreated pig which is unhealthy will remain so in the subsequent month with probability .90, whereas the similar probability is .50 for an unhealthy pig which is treated. Thus spontaneous cure is possible but treatment is beneficial on average.
The challenge is to develop a decision support system for the veterinary doctor to use in her decision making. The story could continue in two versions. In the traditional influence diagram (ID) version, the pig breeder will at all times know whether the pig has been treated earlier and also the previous test results. This story corresponds to a (finite) POMDP. If we extend the story to continue for many months or to have weekly or daily examinations with potential injections associated, the complexity of finding an optimal treatment strategy becomes forbidding.
In the LIMID version of the story and the version we consider here, the pig breeder does not keep individual records for his pigs and has to make his decision knowing only the test result for the given month and the age of the pig. The memory has been limited to the extreme of only remembering the present.
In the LIMID version of the story, the pig breeder does not keep individual records for his pigs and has to make his decision knowing only the test result for the given month. The corresponding diagram is displayed in the figure below.
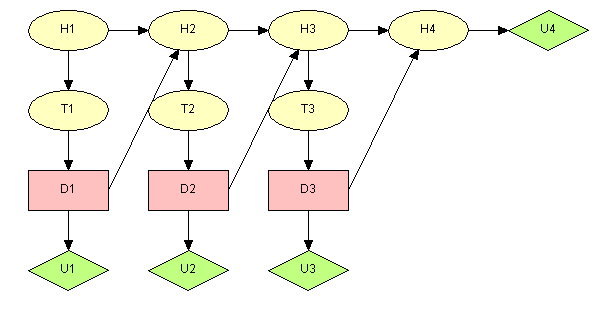
Figure 1: LIMID representing the domain of the pigs breeding problem.
A web interface supporting the first decision of this network may look like this:
The expected utility of the LIMID is whereas the expected utility of U4 is .
Select test result 1:
Treatment Options as D1
Option
Probability
Expected Utility
No treat
Treat
*
*: this option has zero expected utility as it is impossible under the identified strategy and therefore has zero probability under this strategy producing an expected utility of zero.
The table above shows that the policy for D1 is always no treat. The expected utility and probability of future decisions are shown below.
D2
Probability
Expected Utility
No treat
Treat
D3
Probability
Expected Utility
No treat
Treat
The policies for decision D2 and D3 are not shown above.
The example and a large part of the text are taken from Lauritzen & Nilsson (2001).
References
Lauritzen, S. L. and Nilsson, D., (2001), Representing and solving decision problems with limited information. Management Science, 47, 1238 - 1251.